E-commerce has been constantly changing the way the world shops, and this shift is only speeding up. Experts suggest the global market will climb to $83.26 trillion by 2030, growing at a rapid 18.9% CAGR.
In the U.S., Amazon remains the clear leader, while across the Asia-Pacific region, it’s the rise of mobile shopping that’s driving much of the momentum.
In this article, we’ll walk through the latest numbers and trends shaping the future of online shopping.
Online Shopping Market Share: Top Picks
- E-commerce should account for 20.5 % of retail sales by 2025.
- The global e-commerce market is projected to reach $83.26 trillion by 2030.
- The Asia-Pacific region is expected to lead growth with a 20.2% CAGR through 2030.
- Amazon’s market share in American e-commerce is 37.6%.
- U.S. online retail sales reached $1.34 trillion in 2024.
- Cross-border e-commerce is expected to surpass $3.37 trillion by 2028.
- Online shopping is preferred by 52% Gen Z.
What Is The Global E-commerce Growth Rate?
- E-commerce is expected to account for 20.5% of global retail sales in 2025, rising to 23.7% by 2030.
Source: eMarketer, Capital One Shopping
- The US e-commerce growth slowed to 5.3% YoY in Q2 2025, the slowest rate since Q4 2022, when it increased 3.4%.
Source: digitalcommerce360
- The global e-commerce market size was actually $25.93 trillion in 2023. By 2030, it is projected to reach $83.26 trillion, with an 18.9% CAGR.
| Sr. No. | Year | Estimated Market Size |
|---|---|---|
| 1 | 2030 | $83.26 trillion* |
| 2 | 2029 | $73.06 trillion* |
| 3 | 2028 | $61.48 trillion* |
| 4 | 2027 | $51.73 trillion* |
| 5 | 2026 | $43.54 trillion* |
| 6 | 2025 | $36.65 trillion* |
| 7 | 2024 | $30.83 trillion* |
| 8 | 2023 | $25.93 trillion |
*estimated
Source: GVR
- The global e-commerce sales grew 55.3% since 2021, reaching $8.3 trillion in projected sales for 2025.
Source: Clearlypayments
- By 2025, 21% of retail purchases are expected to be made online, rising to 22.6% by 2027.
Source: Statista
- The Asia-Pacific region is leading the e-commerce growth with a 20.2% CAGR from 2024 to 2030, driven by mobile adoption and a young demographic.
You can also read more in detail inside our Smartphone adoption statistics.
Source: GVR
- Cross-border e-commerce is expected to grow 108% between 2023 & 2028, reaching over $3.37 trillion by 2028.
Source: AMZ Scout
Which Retailer Has The Greatest Online Market Share?
- Amazon is the most significant player in online retail, with a market capitalization of $2.13 trillion as of early 2025.
- Alibaba comes in second, with a focus primarily on China, at $316.42 billion.
- Amazon’s market capitalization is 573 times larger than that of its closest competitor, Alibaba. This proves Amazon’s dominance in the online shopping sector.
- Chinese companies account for 40% of the top 10 e-commerce firms.
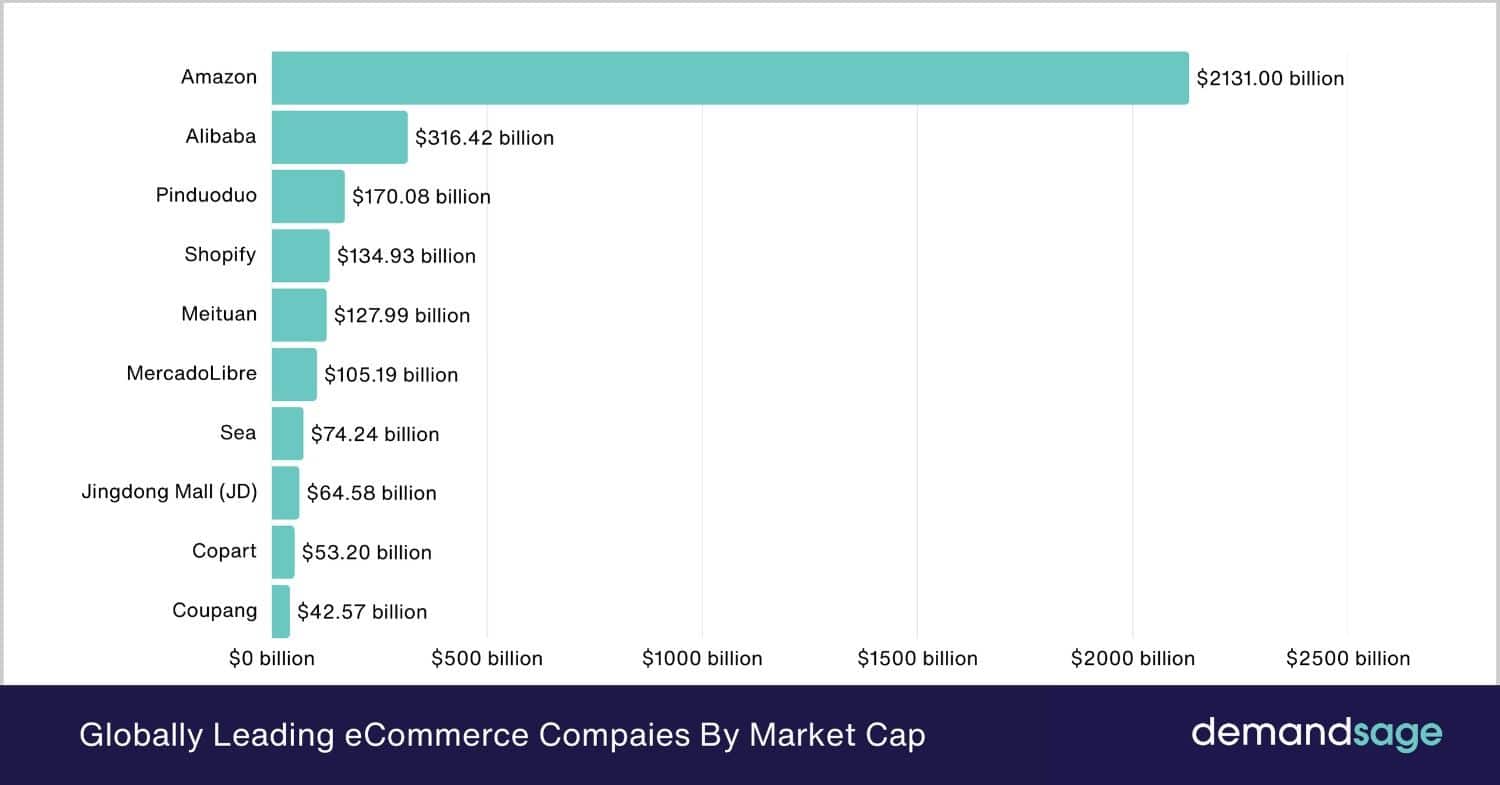
| Sr. No. | Company | Country | Market Cap |
|---|---|---|---|
| 1 | Amazon | United States | $2.131 trillion |
| 2 | Alibaba | China | $316.42 billion |
| 3 | Pinduoduo | China | $170.08 billion |
| 4 | Shopify | Canada | $134.93 billion |
| 5 | Meituan | China | $127.99 billion |
| 6 | MercadoLibre | Argentina | $105.19 billion |
| 7 | Sea | Singapore | $74.24 billion |
| 8 | Jingdong Mall (JD) | China | $64.58 billion |
| 9 | Copart | United States | $53.20 billion |
| 10 | Coupang | South Korea | $42.57 billion |
Source: Statista
Note: Market Cap Changes Every Day.
Who Is The #1 Retailer In The US?
- Amazon holds a commanding lead in U.S. retail, capturing 37.6% of the market in 2024.
- By comparison, Walmart comes in a distant second with just 6.4%.
- Apple maintains 3.6% of the US online retail market.
- eBay captures 3.0% of the US ecommerce market share.
- Target, Home Depot, and other players hold less than 2% market share each.
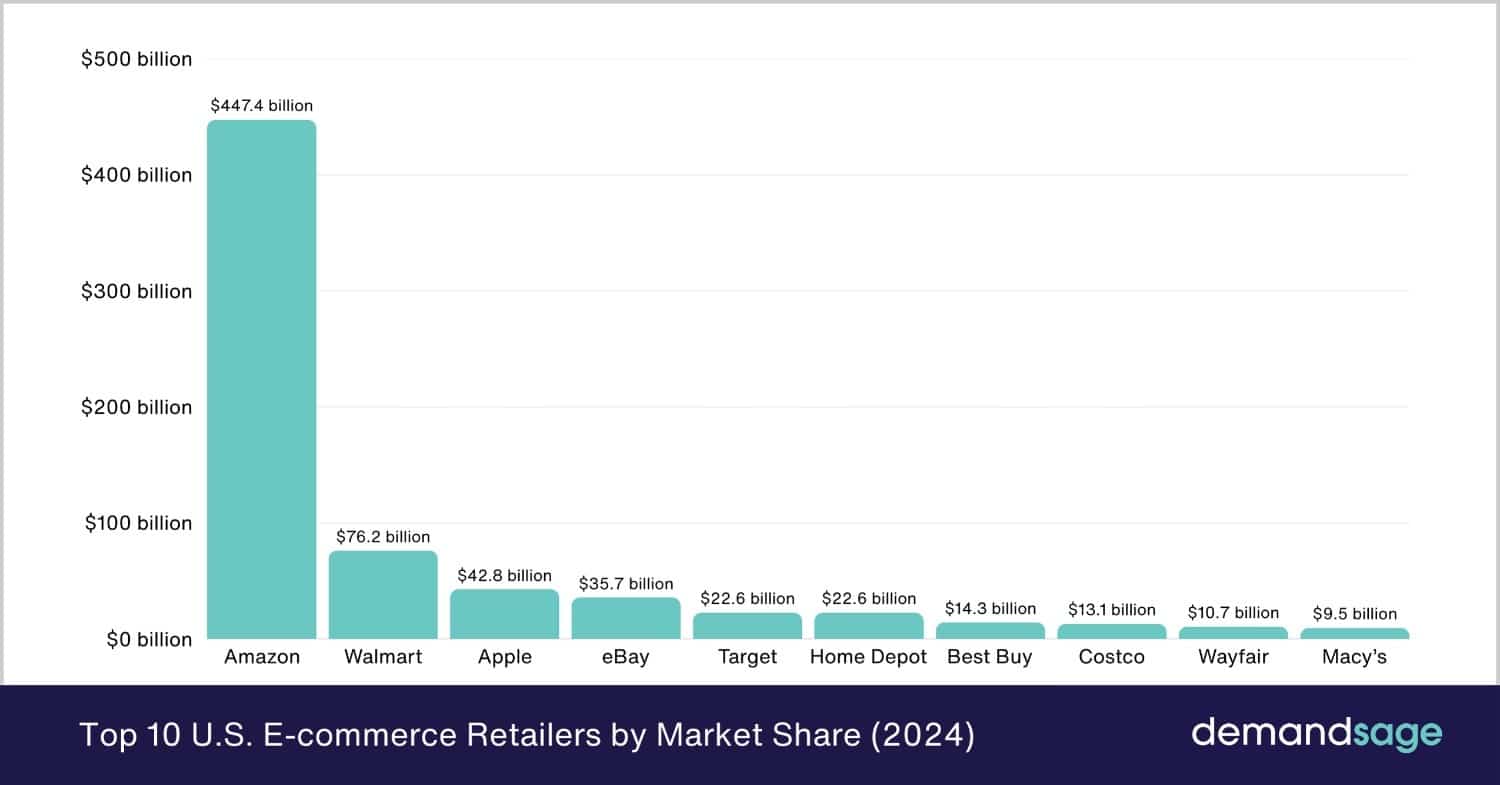

| Rank | Retailer | Market Share (%) | Ecommerce Sales (2024) |
|---|---|---|---|
| 1 | Amazon | 37.6% | $447.4 billion |
| 2 | Walmart | 6.4% | $76.2 billion |
| 3 | Apple | 3.6% | $42.8 billion |
| 4 | eBay | 3.0% | $35.7 billion |
| 5 | Target | 1.9% | $22.6 billion |
| 6 | Home Depot | 1.9% | $22.6 billion |
| 7 | Best Buy | 1.2% | $14.3 billion |
| 8 | Costco | 1.1% | $13.1 billion |
| 9 | Wayfair | 0.9% | $10.7 billion |
| 10 | Macy’s | 0.8% | $9.5 billion |
Source: Red Stag Fulfillment
Online Vs In-Store Shopping Statistics
- 52% Gen Z shop online, whereas 48% prefer in-store shopping.
- A majority of millennials prefer online shopping, with 67% expressing a preference for it.
- In contrast, 72% of seniors prefer shopping in-store.
Source: Business Dasher
- During the Black Friday Sale 2024, in the US, 81.7 million shopped in-store, whereas 87.3 million shopped online.
Source: Reuters
- Online purchases accounted for 16.3% of all retail sales in the US during Q2 2025.
Source: U.S. Census Bureau
- As of 2024, physical stores still account for 83.7% of retail sales in the United States.
Source: Fit Small Business
- Approximately 94% of consumers have returned to shopping at physical stores since 2022, while 40% of consumers make in-store purchases every week.
Source: Zippia 1, Zippia 2
- In 2024, online retail sales in the US totaled $1.34 trillion, representing a 9.24% increase from the previous year.
Source: Capital One Shopping
Category-Based Preferences
- Most consumers, about 62%, still prefer to buy their groceries in physical stores.
- Around 40% of people primarily shop for apparel and footwear at brick-and-mortar locations.
- When it comes to personal electronics, 37% favor buying online.
- For fashion, shoes, and accessories, 33% of consumers prefer to shop online.
- Nearly 29% of individuals opt to purchase beauty and personal care products through online platforms.
| Sr. No. | Category | Preference for the Online Channel | Preference for the Offline Channel |
|---|---|---|---|
| 1 | Groceries | 38% | 62% |
| 2 | Apparel & Footwear | 60% | 40% |
| 3 | Personal Electronics | 37% | 63% |
| 4 | Fashion, Shoes & Accessories | 33% | 67% |
| 5 | Beauty & Personal Care Products | 29% | 71% |
Source: Salesso
