

If you are wondering what to make of Marex Group stock right now, you are not alone. Investors seem to have mixed feelings lately. The stock is flat over the past week, which might suggest a bit of indecision, but look closer and the year-to-date dip of 6.0% and a 7.5% drop in the last month are telling a more interesting story. Notably, even with these dips, Marex Group is still up an impressive 22.3% over the past year. This movement hints at both resilience and shifting risk perceptions, something many are trying to decode amid a flurry of sector news and market volatility.
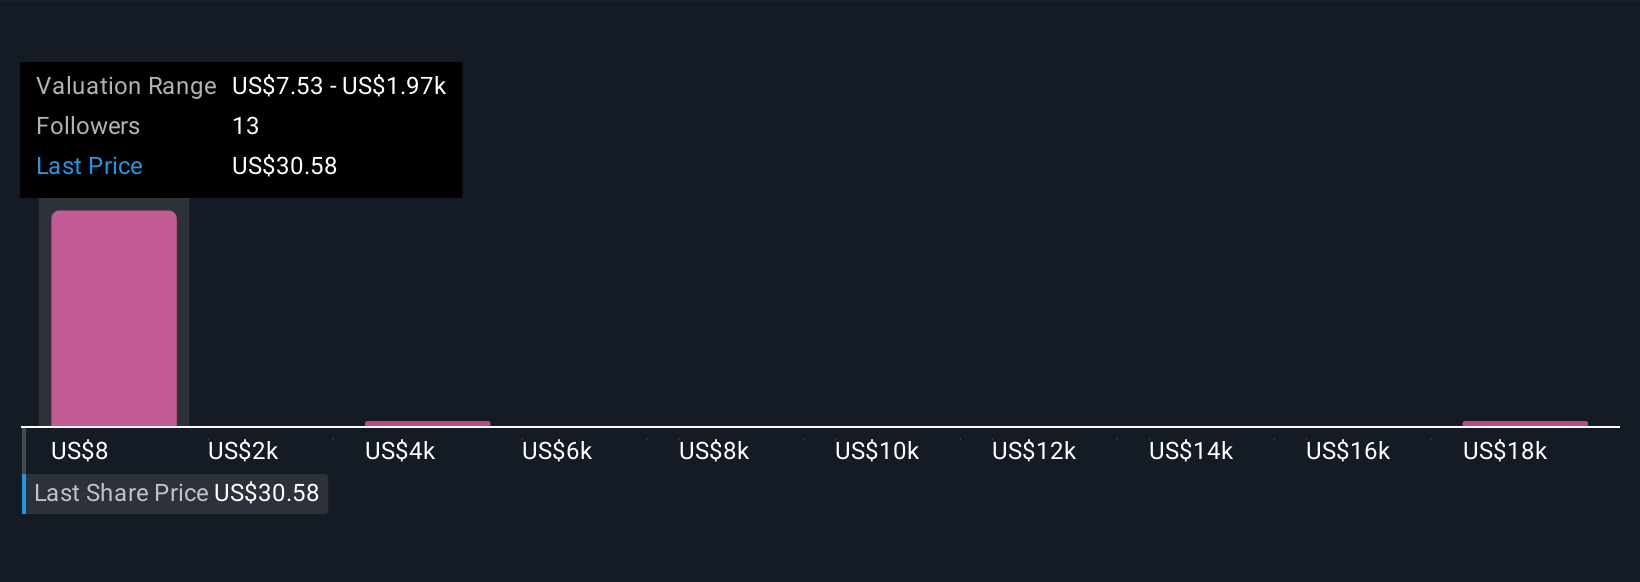
What’s been going on with the company? Recent headlines have centered around Marex Group’s continued global expansion and the strengthening of core business operations. Investors are clearly weighing the firm’s near-term uncertainty against longer-term growth drivers. With a last close at 30.58, some might see volatility, but others see an opportunity.
The big question, of course, is whether Marex Group is currently undervalued, fully priced, or somewhere in between. According to our assessment, the company hit a value score of 6 out of 6, meaning it checked every single box for undervaluation across the most common valuation checks. That is a rare result and definitely worth a closer look.
So, how do we break down that value score? In this article, I will walk you through the methods used to evaluate Marex Group from a valuation perspective, highlighting the strengths and what those numbers really mean. And make sure to read on to the end, where I will also share an even more insightful way to understand what Marex Group’s valuation could mean for you as an investor.
Marex Group delivered 22.3% returns over the last year. See how this stacks up to the rest of the Capital Markets industry.
Approach 1: Marex Group Excess Returns Analysis
The Excess Returns model evaluates a stock by comparing how much value the company creates for shareholders above its cost of equity. In other words, it looks at the additional profits generated by Marex Group for every dollar invested, once the minimum required return by investors is accounted for. This approach highlights both the sustainability of profits and the efficient use of capital over time.
For Marex Group, here is how the numbers compare:
- Book Value: $14.14 per share
- Stable Earnings Per Share (EPS): $3.69 per share (sourced from the median Return on Equity over the past five years)
- Cost of Equity: $2.20 per share
- Excess Return: $1.49 per share
- Average Return on Equity: 17.51%
- Stable Book Value: $21.08 per share (from weighted future estimates by two analysts)
Using this methodology, Marex Group is estimated to have a fair value of $41.42 per share. Given the recent closing price of $30.58, the Excess Returns model implies the stock is trading at a 26.2% discount to its intrinsic value. This notable margin suggests Marex Group is currently undervalued relative to the returns it is generating for shareholders.
Result: UNDERVALUED
Head to the Valuation section of our Company Report for more details on how we arrive at this Fair Value for Marex Group.
Our Excess Returns analysis suggests Marex Group is undervalued by 26.2%. Track this in your watchlist or portfolio, or discover more undervalued stocks.
Approach 2: Marex Group Price vs Earnings
The Price-to-Earnings (PE) ratio is a reliable valuation measure for profitable companies like Marex Group because it puts the current share price in context with the company’s earnings power. In simple terms, it tells us how much investors are willing to pay for each dollar of earnings, which is particularly insightful when those earnings are stable and growing.
It’s important to remember that a “normal” or “fair” PE ratio is influenced by growth expectations and risk levels. Companies expected to grow faster, or those seen as lower risk, tend to command higher PE ratios. On the other hand, slow growth or perceived risks can push the ratio down.
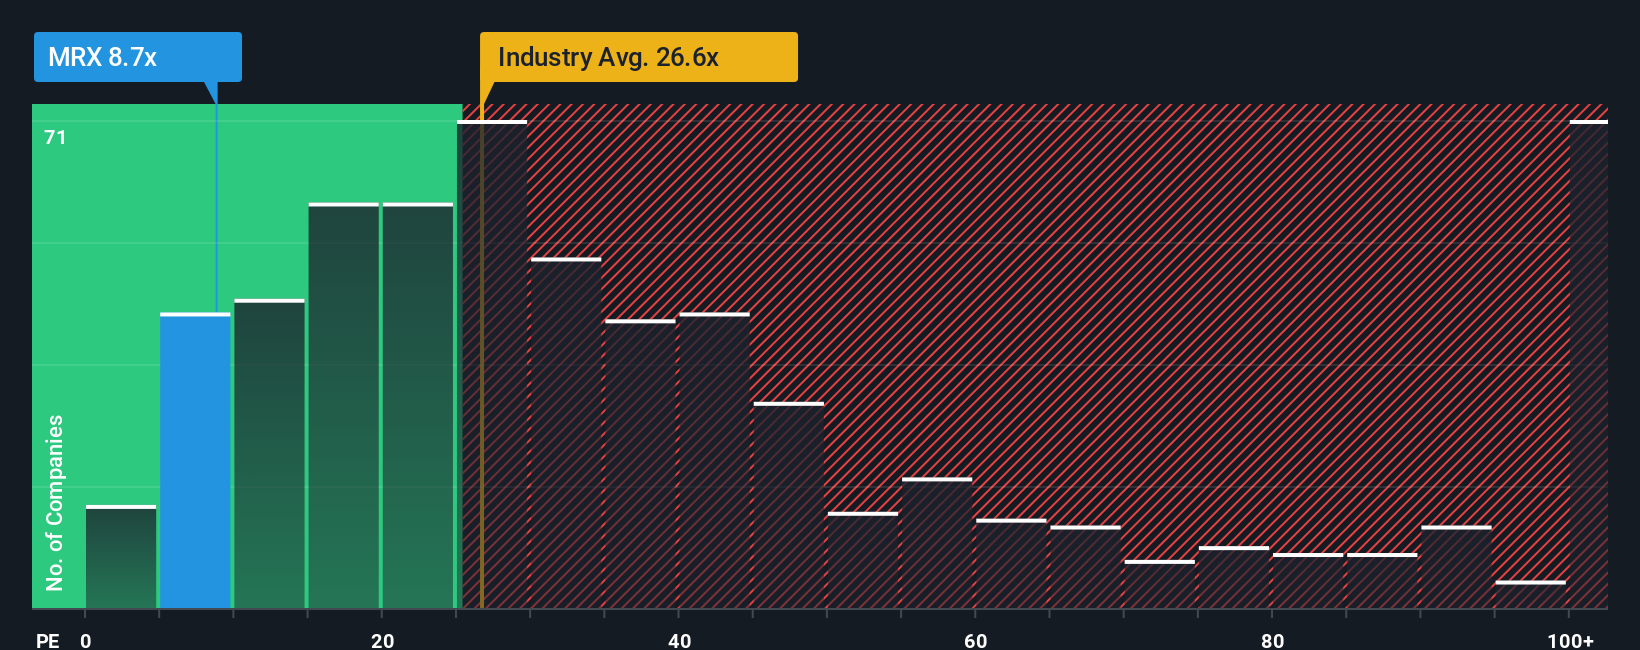
Right now, Marex Group is trading at a PE of 8.7x. For context, the industry average for Capital Markets companies is 26.1x, and close peers are at 21.4x. This suggests Marex appears significantly cheaper on a relative basis.
Simply Wall St also calculates a custom “Fair Ratio” for every stock, factoring in unique aspects like profit margins, earnings growth, market cap, and risk, making it a more tailored benchmark. For Marex Group, the Fair Ratio is 14.9x, which is well above its current PE.
When comparing the Fair Ratio and Marex’s current PE, there is a notable discount. This analysis indicates Marex Group is undervalued using the earnings multiple method.
Result: UNDERVALUED
PE ratios tell one story, but what if the real opportunity lies elsewhere? Discover companies where insiders are betting big on explosive growth.
Upgrade Your Decision Making: Choose your Marex Group Narrative
Earlier we mentioned there’s an even better way to understand valuation, so let’s introduce you to Narratives. A Narrative is a story that puts your perspective or outlook on a company like Marex Group into numbers, connecting how you think about its future to a set of forecasts such as revenue growth, profit margins, and fair value estimates. Narratives go beyond simple ratios by linking the company’s real-world story, its detailed financial model, and a resulting fair value. This approach makes investment analysis more personal and actionable.
On Simply Wall St’s Community page, Narratives are an accessible tool trusted by millions of investors to quickly translate investment views into numbers. This helps you decide when a stock like Marex Group is undervalued or overpriced by comparing your Fair Value to the current share price. Narratives update dynamically as new news and financial results come in, so your investment thesis always reflects the latest reality. For example, some investors may see Marex’s upside and set a high Narrative fair value near $58 per share based on strong profit margin expansion and global diversification. Others may adopt a cautious view due to governance risks and project a lower fair value of $36. Narratives help you see all these perspectives, so your investment decisions are grounded in your own story for Marex Group, not just the numbers.
Do you think there’s more to the story for Marex Group? Create your own Narrative to let the Community know!
This article by Simply Wall St is general in nature. We provide commentary based on historical data
and analyst forecasts only using an unbiased methodology and our articles are not intended to be financial advice. It does not constitute a recommendation to buy or sell any stock, and does not take account of your objectives, or your
financial situation. We aim to bring you long-term focused analysis driven by fundamental data.
Note that our analysis may not factor in the latest price-sensitive company announcements or qualitative material.
Simply Wall St has no position in any stocks mentioned.
New: Manage All Your Stock Portfolios in One Place
We’ve created the ultimate portfolio companion for stock investors, and it’s free.
• Connect an unlimited number of Portfolios and see your total in one currency
• Be alerted to new Warning Signs or Risks via email or mobile
• Track the Fair Value of your stocks
Try a Demo Portfolio for Free
Have feedback on this article? Concerned about the content? Get in touch with us directly. Alternatively, email editorial-team@simplywallst.com