
Study population
This study used data from a population-based cohort created by the National Health Insurance Service (NHIS) in South Korea. The NHIS is a compulsory health insurance system that includes all Korean residents and provides coverage for a wide range of health services [14]. Participants were advised to undergo comprehensive medical examinations [14].
Our analysis included data from 4,157,101 participants who attended the national health screening at least three times from 2002 to 2007. We excluded 88,510 people younger than 30 years, 10,491 deaths, 74,688 cancer cases, and 532,223 individuals with missing information on lifestyle behaviors during the 2002–2007 period. After these exclusions, a total of 3,451,189 eligible participants remained for analysis (Supplement Fig. 1).
Exposure and covariates
Lifestyle risk score
Information was collected over three biennial visits regarding four unhealthy lifestyle behaviors: current smoking, heavy drinking, excess body weight, and physical inactivity. Each behavior was categorized into three groups: 0 (ideal level), 1 (intermediate level), and 2 (poor level) (Table 1). The lifestyle risk score, ranging from 0 to 8, represents the total of the four scores, with higher values indicating greater unhealthy lifestyles.
Body weight categories included: (0) normal weight (<23.0 kg/m2), (1) overweight and obese (23.0–29.9 kg/m2), and (2) severity obese (≥30.0 kg/m2) [15]. Tobacco smoking status was classified: (0) non-smoker, (1) former smoker, and (2) current smoker. Alcohol consumption was determined based on daily intake and categorized: (0) non-drinker (0 g/day), (1) light drinker (≤50.0 g/day), and (2) heavy drinker (>50.0 g/day) [16]. Physical activity levels were categorized by exercise frequency per week as: (0) regular (5–7 times/week), (1): sometimes (1–4 times/week), and (2): rarely (<1 time/week).
Covariates
Demographic information, including age, income level using health insurance premiums, Charlson Comorbidity Index (CCI), family history of cancer, and the existence of chronic viral hepatitis B or C infection, was gathered from the baseline of 2002–2003. CCI was treated as a continuous variable, while other covariates were categorized as follows: age (30–39, 40–49, 50–59, ≥60 years), income (5 quintiles), family history of cancer (yes or no), and chronic viral hepatitis B or C infections (yes or no).
Case ascertainment
Our outcome of interest was primary cancer incidence which includes all cancer combinations, cancer subgroupings (alcohol-, tobacco-, and obesity-related cancers), and specific cancer types. These were identified using claim data linked to the Korea Central Cancer Registry database, based on the International Classification of Diseases 10th Revision (ICD-10: C00-C97).
Alcohol-related cancers included colorectal cancer [C18–C20], female breast cancer [C50], upper aero-digestive (UADT) cancers ([C01–C10 without C08 = salivary gland], larynx [C32], pharynx [C11–C14], esophagus [C15]), and liver cancer [C22–C24] [17, 18].
Tobacco-related cancers included upper aero-digestive cancers ([C01–C10 without C08 = salivary gland], larynx [C32], pharynx [C11–C14], esophagus [C15]), liver [C22–C24], pancreas [C25], bladder [C67], kidney [C64, C65], cervix [C53], stomach [C16], trachea [C33], lung [C34], acute myeloid leukemia [C92], and colorectal [C18–C20] [18].
Obesity-related cancers included esophagus [C15], pancreas [C25], colorectal [C18-C20], breast [C50], endometrium [C54], kidney [C64, C65], thyroid [C73], and gallbladder [C23] [17].
Statistical methods
Trajectory analysis
Trajectory analysis has become a valuable tool in epidemiological research for identifying longitudinal changes over time [13]. Group-based trajectory modeling (GBTM) is often chosen by investigators due to its effectiveness, and simplicity [12]. In our study, we independently calculated lifestyle risk scores for the periods 2002–2003, 2004–2005, and 2006–2007. Trajectory was then determined using GBTM with the PROC TRAJ package in SAS version 9.4. To determine the optimal number of groups, we initially evaluated one-to-eight quadratic models for men and one-to-six quadratic models for women. Further increases in group numbers were avoided to prevent excessively small group memberships. The Bayesian Information Criterion (BIC) was used to determine the most favorable number of groups, considering model parsimony, distinct features, and group membership percentages (≥1%). A model with seven groups for men and four groups for women was selected according to predefined criteria (Supplement Tables 1 and 2).
The next step was to identify the functional forms of each group based on the significance (p-value < 0.05) in models with different polynomial degrees, starting with the quadratic polynomial. The final model for men included seven quadratic trajectories, whereas the model (2221) was chosen for women.
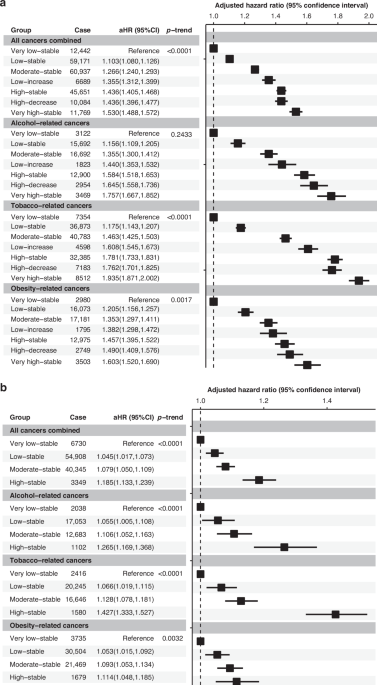
Men were divided into seven groups: (1) very low-stable (N = 122,457, 5.32%, mean lifestyle risk score at each wave = 1.5); (2) low-stable (N = 634,559, 27.59%, mean = 3); (3) moderate-stable (N = 682,877, 29.69%, mean = 4); (4) low-increase (N = 73,209, 3.18%, mean score increase from 3 to 5); (5) high-stable (N = 544,015, 23.65%, mean = 5); (6) high-decrease (N = 102,193, 4.44%, mean score decrease from 5 to 3); and (7) very high-stable (N = 140,946, 6.13%, mean = 5.7) (Supplement Fig. 2).
Women were divided into four groups: (1) very low-stable (N = 76,606, 6.66%, mean = 1; (2) low-stable (N = 614,213, 53.37%, mean = 2); (3) moderate-stable (N = 426,982, 37.10%, mean = 3; and (4) high-stable (N = 33,132, 2.88%, mean = 4) (Supplement Fig. 3).
The selected models were then evaluated for their accuracy using the average posterior probability of assignment (AvePP), odds of correct classification (OCC), and estimated group probabilities compared to the percentage of the population assigned to the group. In our study, all groups in both genders had AvePP exceeding 0.7 and OCC exceeding 5.0, indicating accurate group membership classification (Supplement Tables 3 and 4).
Cox proportional hazards models
Cox proportional hazards models were employed to estimate hazard ratios (HRs) and 95% confidence intervals (CIs) for cancer development across different lifestyle risk score trajectories. In both genders, the “very low-stable” group was used as the reference group. Censored cases included participants who passed away or were not experienced in the event between 2008 and 2019. The time-to-event was measured from January 01, 2008, to the date of cancer diagnosis, censoring, or the end of the observation period on 31 December 2019.
Age, income level, CCI, and family history of cancer were adjusted to account for potential confounders. Additionally, chronic viral hepatitis B and C (ICD-10: B18.*) was used to evaluate liver cancer. The Log-rank test was used to assess linear trends, and all models satisfied the assumption of proportional hazards.
Cox models were stratified based on age groups at baseline, employing a cutoff of 50 years, and were subsequently adjusted for covariates. This adjustment was applied to all cancers combined and cancer subgroupings for both genders, including female breast and reproductive-related cancers in women (i.e., ovary, endometrium, and cervical cancers).
To measure the contribution of individual lifestyle factors to the overall observed associations, we divided the population into two subgroups based on trajectory groups: never and ever engaged in unhealthy individual behavior. The “very low-stable” in the second subgroup was chosen as the reference group. This analysis was conducted only among men, as the female population was not sufficiently large for detailed analysis. Analysis of the Cox proportional hazards model was conducted using SAS Enterprise Guide 7.1 (SAS Institute Inc., Cary, NC, USA).