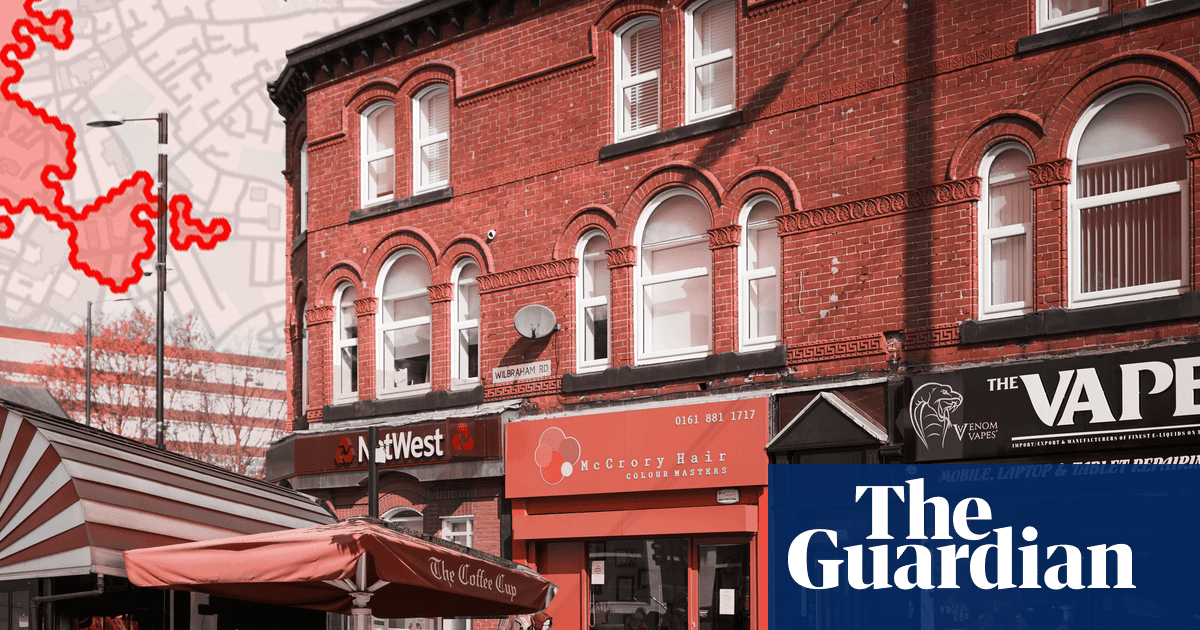
From department stores to discount shops, bookmakers to beauty salons, the makeup of Britain’s high streets has shifted dramatically since 2019. Shopping-led town centres are giving way to areas increasingly dominated by services, food, and leisure – but the scale and shape of that change varies widely from place to place.
The last six years have coincided with a series of shocks to the economy. Lockdowns during the Covid pandemic disrupted footfall and accelerated online retail, while Brexit, energy bill hikes, a cost of living crisis and national changes to wages and employer tax contributions have piled further pressure on both independent businesses and national chains. What remains on Britain’s high streets – and what has disappeared – offers a snapshot of how the country shops, eats and spends its time.
Enter your postcode to explore the types of high street businesses that were operating near you in 2019 and how that picture compares with 2025. Unfortunately, our data does not cover Northern Ireland.
Find your local high street
Loading map for your area…
Tap and drag to move around map
Your four nearest retail areas are:
- London – Regional Centre
- Store Street; Bloomsbury – Small Local Centre
- Southampton Row; Bloomsbury – Small Local Centre
- Southampton Row; Bloomsbury – 1 – Small Local Centre
The relative vacancy rate is 7%, compared to 5% nationally*. These areas
together have a higher share of empty shops when compared to the national average.
We have grouped four areas so the data is more representative.
How the makeup of your local area differs from the average British high
street
We have selected a few interesting categories here, but this isn’t a
comprehensive list of all types of shops.
The percentage of businesses in your area that belong to a selected
category, compared to the percentage on the average street
Here’s what’s up and down in your local area**:
Going up
1078
restaurants, 41%
up
from 766 in 2019
535
cafes, snack bars and tea rooms, 14%
up
from 469 in 2019
443
pubs, bars and inns, 16%
up
from 381 in 2019
342
barbers and hairdressers, 13%
up
from 303 in 2019
51
gymnasiums, sports halls and leisure centres, 19%
up
from 43 in 2019
16
tattooing and piercing services, 60%
up
from 10 in 2019
Going down 
94
cash machines, 31%
down
from 136 in 2019
92
banks and building societies, 20%
down
from 115 in 2019
45
nightclubs, 20%
down
from 56 in 2019
37
books and maps, 20%
down
from 46 in 2019
37
optometrists and opticians, 20%
down
from 46 in 2019
37
chemists and pharmacies, 10%
down
from 41 in 2019
Restaurants v shops
The main change in Britain’s high streets is the shift away from
retailers like clothes shops and towards eating and drinking businesses
like restaurants or cafes. But here’s what’s happening in your area
*Vacancy estimate is calculated by benchmarking September 2025 business
numbers against the past decade – 0% means it’s a decade-high
**Categories chosen from a selection of businesses that are significant
in British high streets
About the data
The Guardian took high street boundaries from Retail Centre Boundaries and Open Indicators data published by the Geographic Data Service.
The number and type of businesses on each high street in 2019 and 2025 were taken from the PointX dataset published by Landmark Information Group and distributed by Ordnance Survey. This data unfortunately does not cover Northern Ireland, meaning the tool won’t work for postcodes there.
Vacancy rates were estimated by comparing the number of businesses in Point X with the maximum number of businesses recorded over the years 2016 to 2025. The vape shop category was generated by the Guardian based on the names of businesses – meaning some vape shops that aren’t a major chain or contain vape-related keywords in their name – and shops that sell other things besides vapes – might fall under the food, drink and multi item retail category instead.